The "Analytics" section of your affiliate dashboard centralizes all data related to your indirect sales. It lets you measure how effective your partners are, identify your best-performing products, and adjust your commission strategy to maximize your growth.
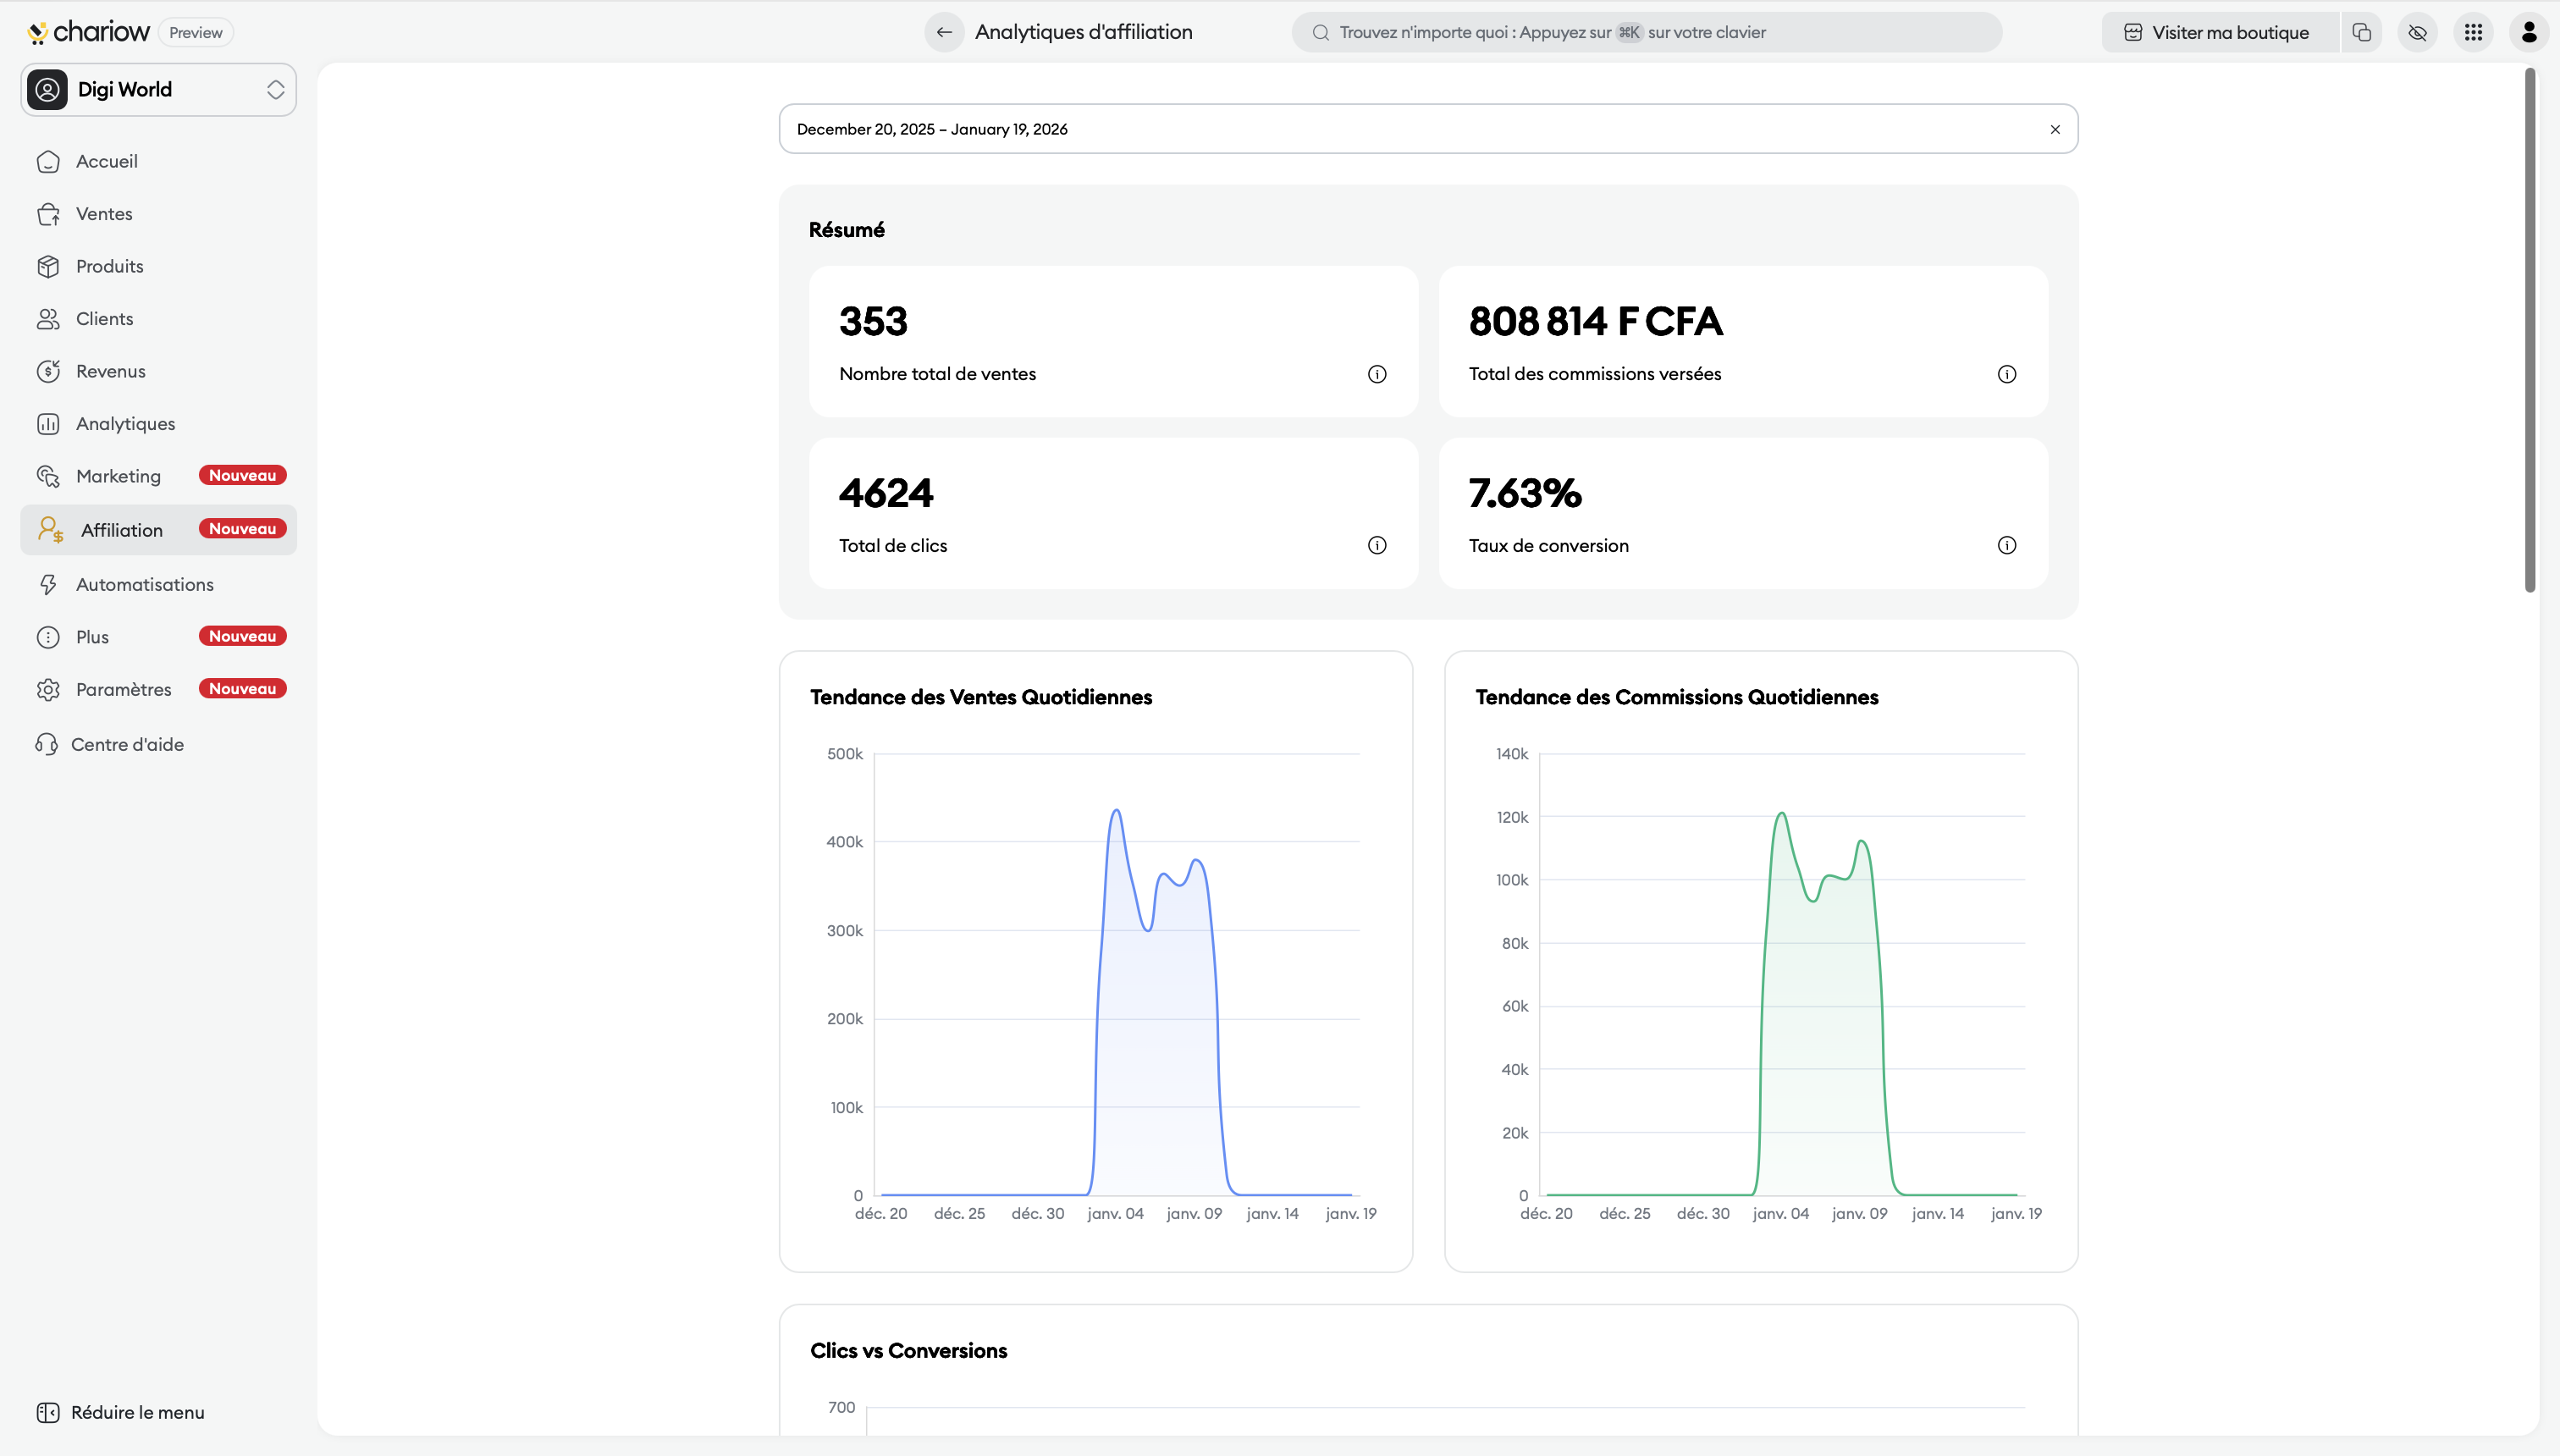
The top of your interface shows an overall summary of activity for the selected period:
Total number of sales : The overall volume of transactions generated by your network.
Total commissions paid : The total amount of earnings collected by your affiliates.
Total clicks : The raw traffic sent by your partners to your store.
Conversion rate : The percentage of clicks that resulted in an actual sale.
Three main charts let you see how your activity is evolving:
Daily Sales Trend : A line chart showing how your revenue progresses day after day.
Daily Commissions Trend : See how your daily generated commission amounts fluctuate.
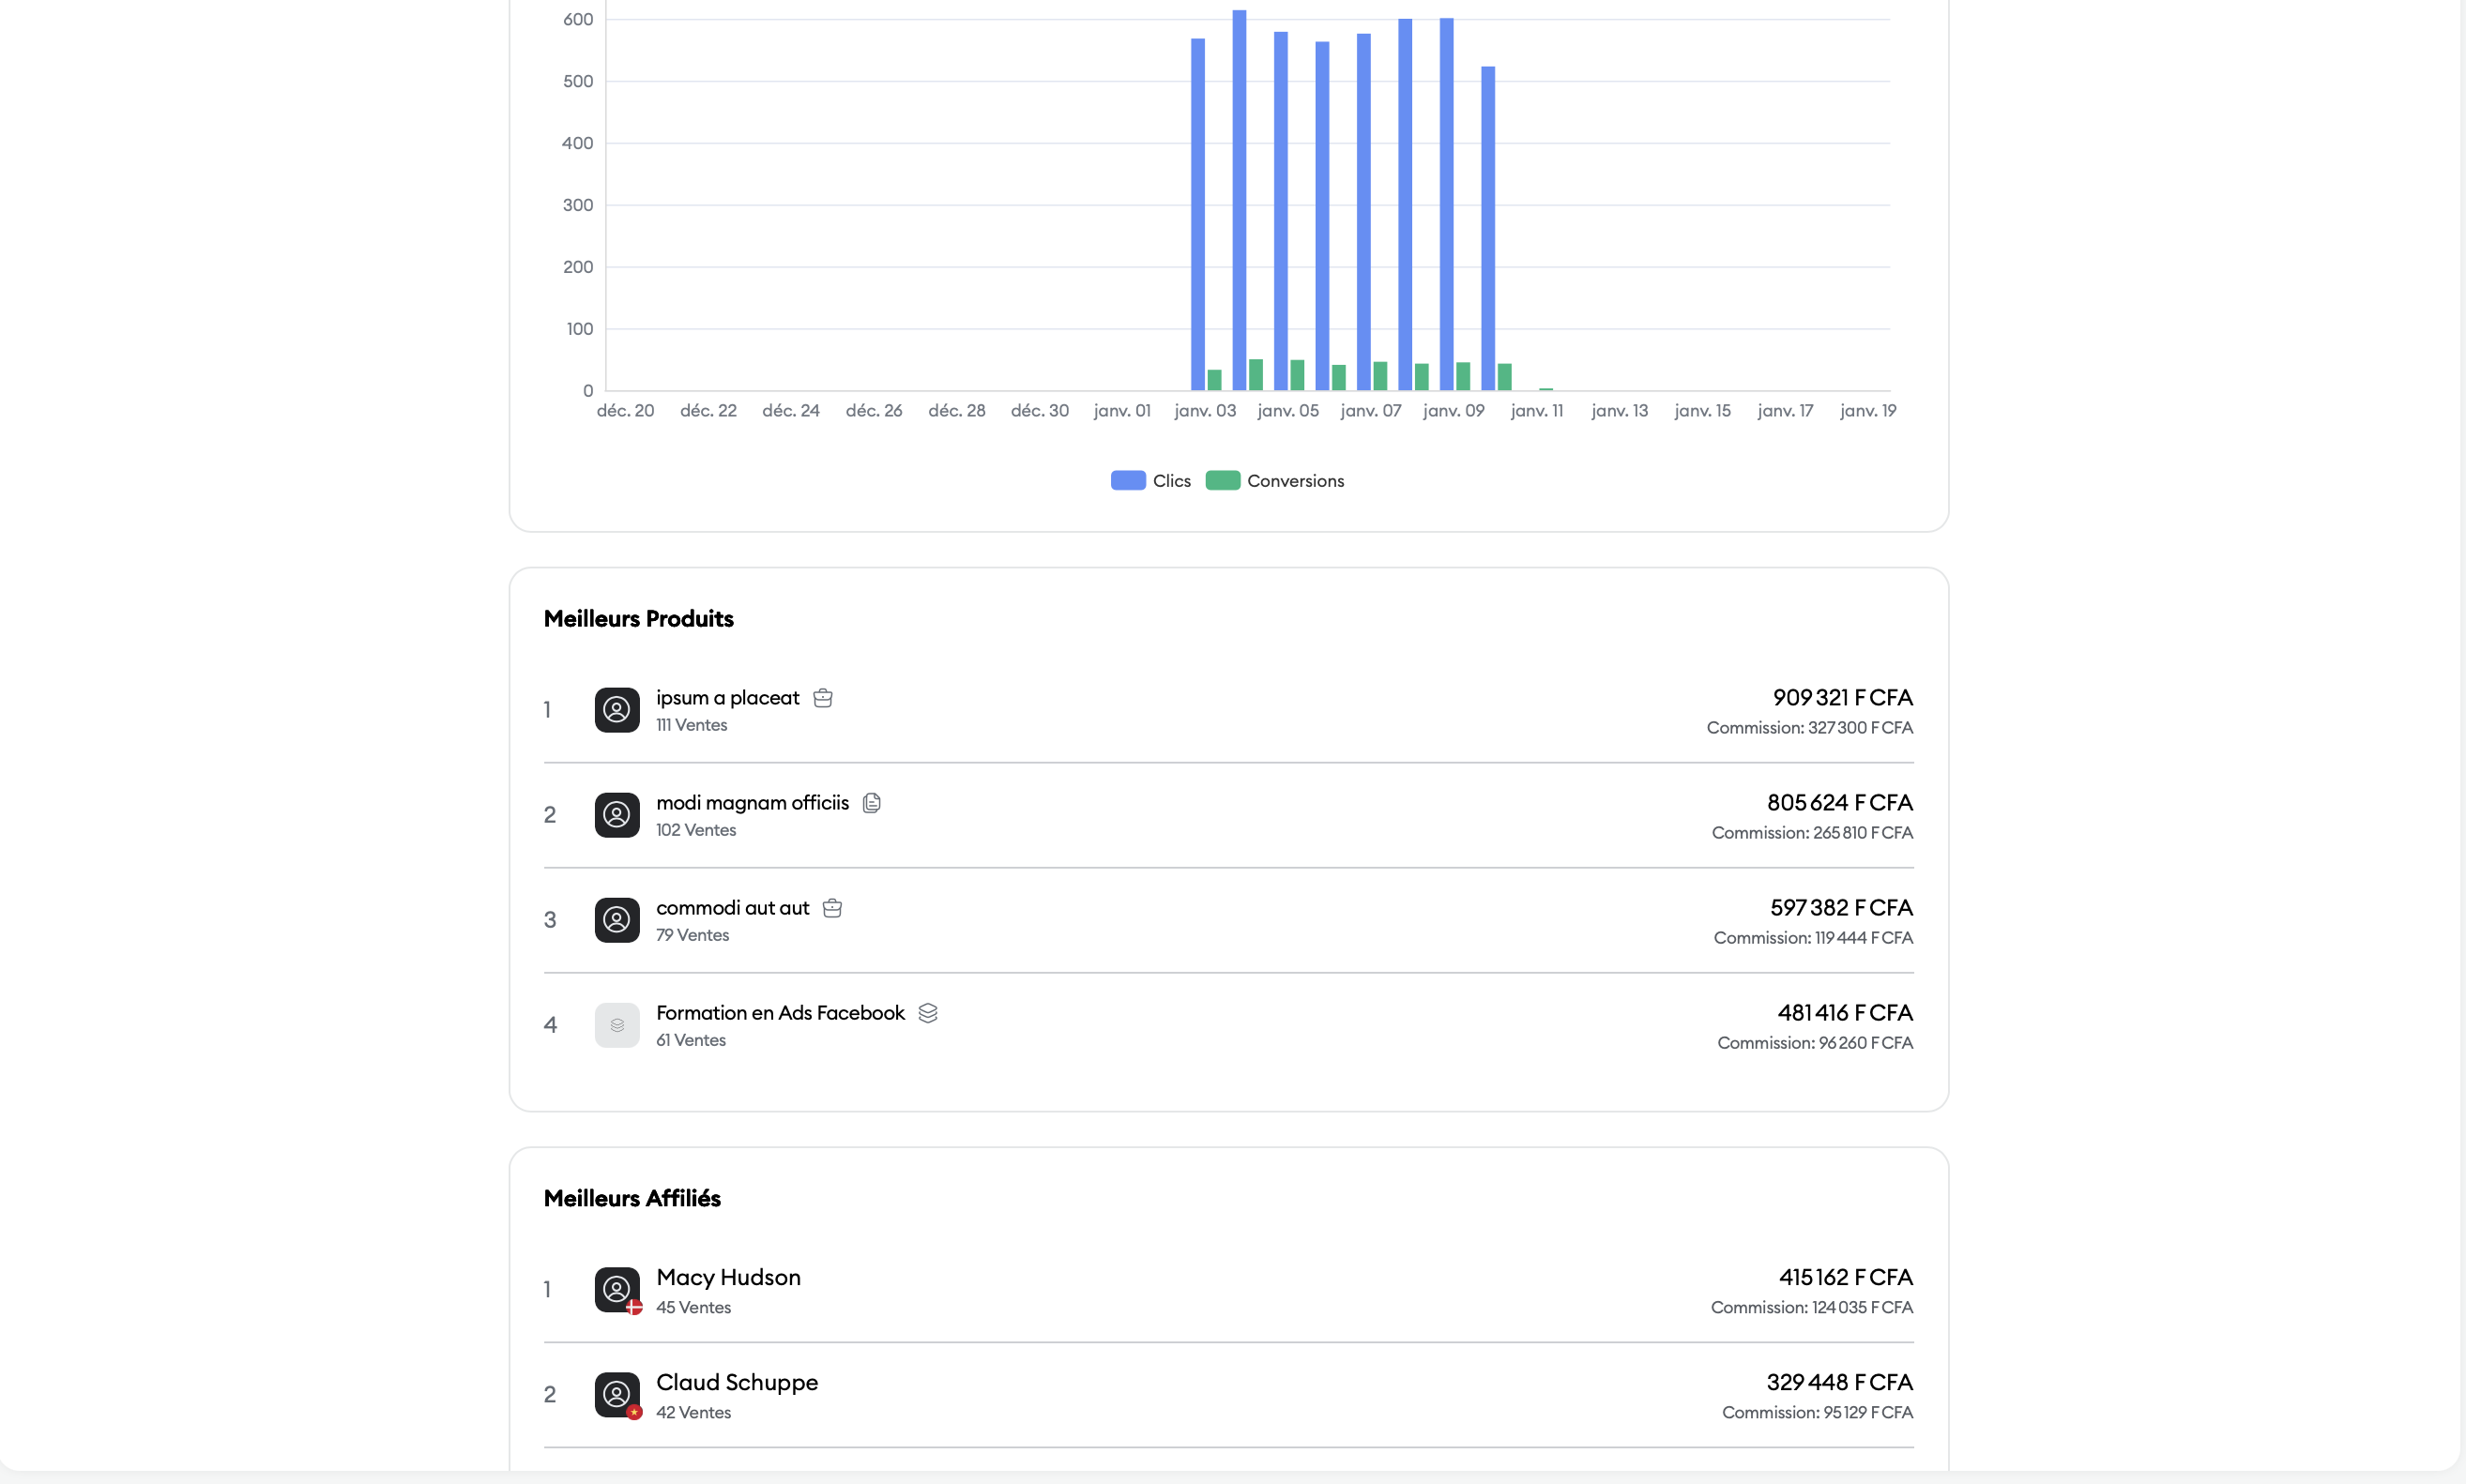
Clicks vs Conversions : A bar chart comparing traffic volume (clicks) with actual performance (conversions) to assess the quality of incoming traffic.
To optimize your catalog and your relationships, check your dynamic rankings:
This section lists your best-selling items through affiliation. For each product, you can see:
The total revenue generated.
The exact number of sales.
The total amount of associated commissions.
Identify your best-performing partners so you can eventually offer them exclusive "Partnerships". The data includes:
The total revenue brought in by the affiliate.
Their sales volume.
The total commissions they generated.
Adjust your commissions: If a product is one of your top sellers but has a low conversion rate, consider increasing its commission to better motivate affiliates.
Retain your top performers: Use the "Top Affiliates" ranking to spot those who deserve special conditions through personalized offers.
Need help? Contact our support via chat or at [email protected].