Analytics data is a major asset for optimizing your online store. The Analytics section of your Chariow dashboard was designed to provide you with precise information on visitor behavior and the performance of your products.
Here's a detailed guide to help you fully understand and use these statistics.
Understanding your store's traffic is like getting direct feedback from your customers. By viewing this data, you can:
Identify trends: Pinpoint the days and times when your store gets the most visits to adjust your marketing campaigns.
Evaluate the effectiveness of your actions: Measure the impact of your social media posts, ads, or collaborations.
Discover your most popular items: Identify which products are generating the most interest. This will help you know which ones to highlight and potentially restock or promote more heavily.
The section is divided into several key indicators that give you a complete view of your store's performance.
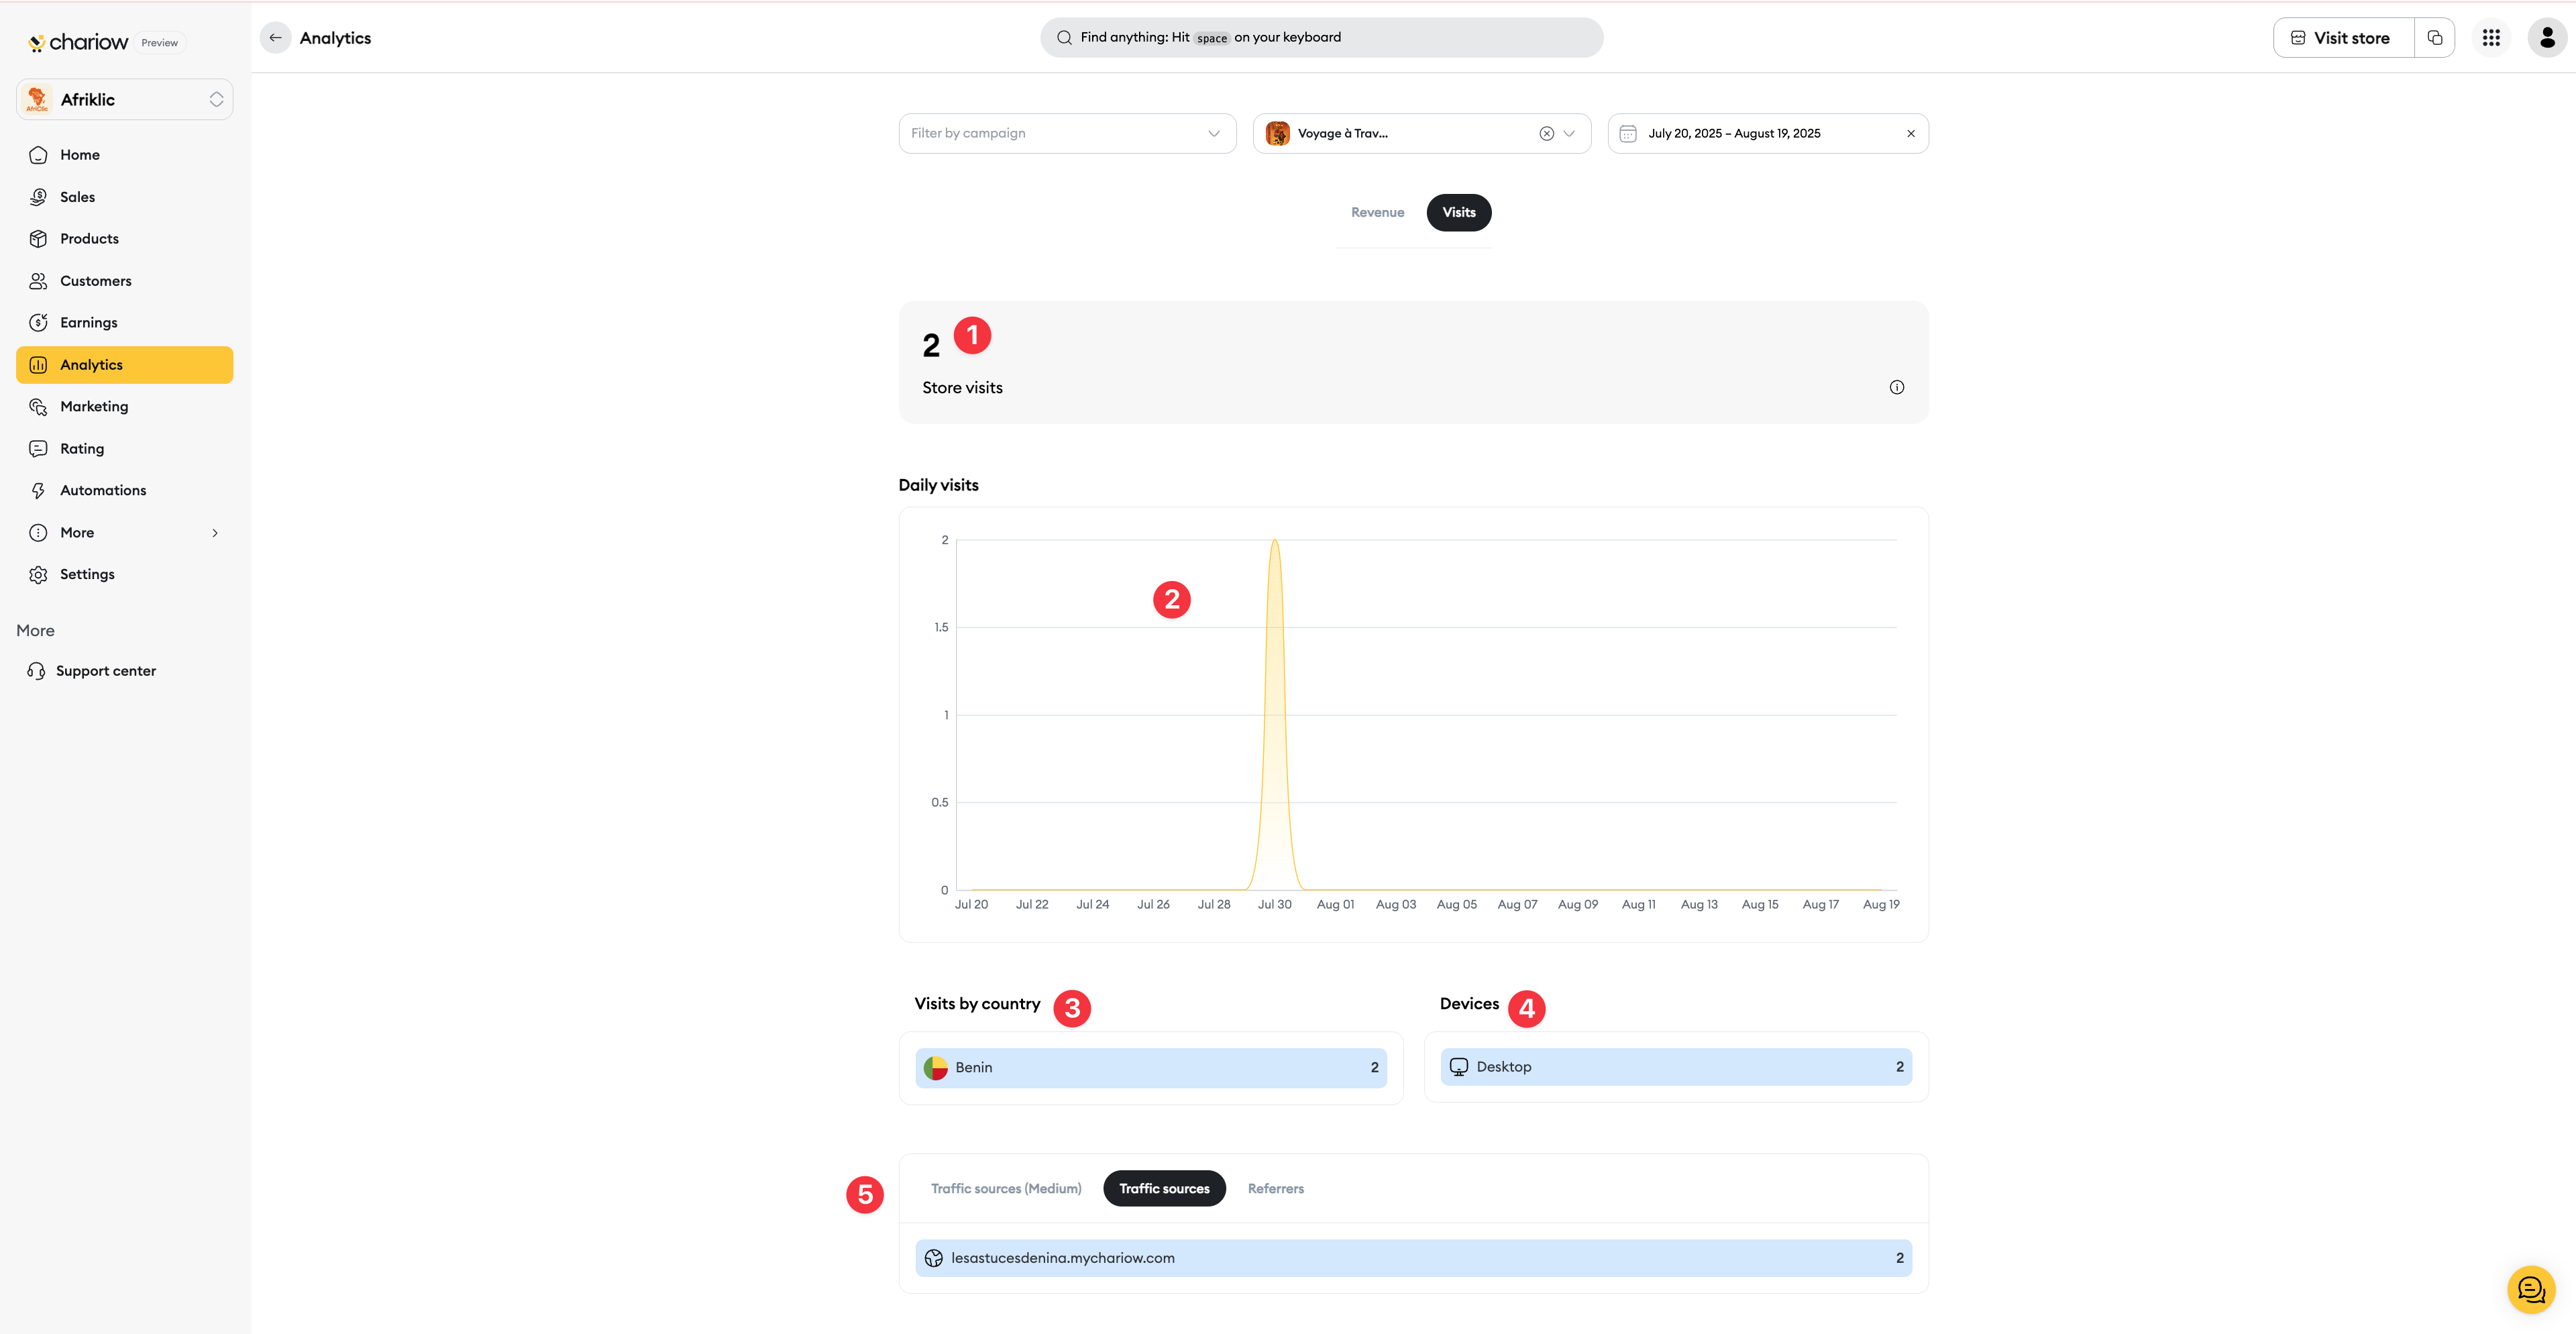
Store Visits: This number gives you a quick overview of the total number of visits to your store. It’s a key indicator for measuring the effectiveness of your marketing efforts.
Daily Visits: The daily activity curve allows you to visualize traffic peaks and the days when your store receives the most visitors.
Visits by Country: Identify the countries your visitors come from. This information is valuable for targeting your ad campaigns or adapting your products for new markets.
Devices: Track the distribution of visits by device (e.g., "Desktop" or "Mobile"). This data helps you ensure that the user experience is optimized for all types of devices.
Traffic Sources: Understand where your traffic comes from (e.g., social media, direct links, etc.). This allows you to focus your marketing efforts on the highest-performing channels.
Optimize your best-selling products: If a product has a low conversion rate despite a lot of visits, consider revamping its description or photos.
Adapt your marketing strategy: If your traffic is coming from Facebook, focus on creating content for that platform.
Test and adjust: Don't hesitate to run tests. For example, change a product's thumbnail and check the analytics to see if the number of clicks increases.
By intelligently using the data in the Analytics section, you can make informed decisions and turn simple store management into a real growth strategy.
Need help? Reach our support via chat or at [email protected]