Analytics in the main menuThe Analytics section displays a number of key indicators :
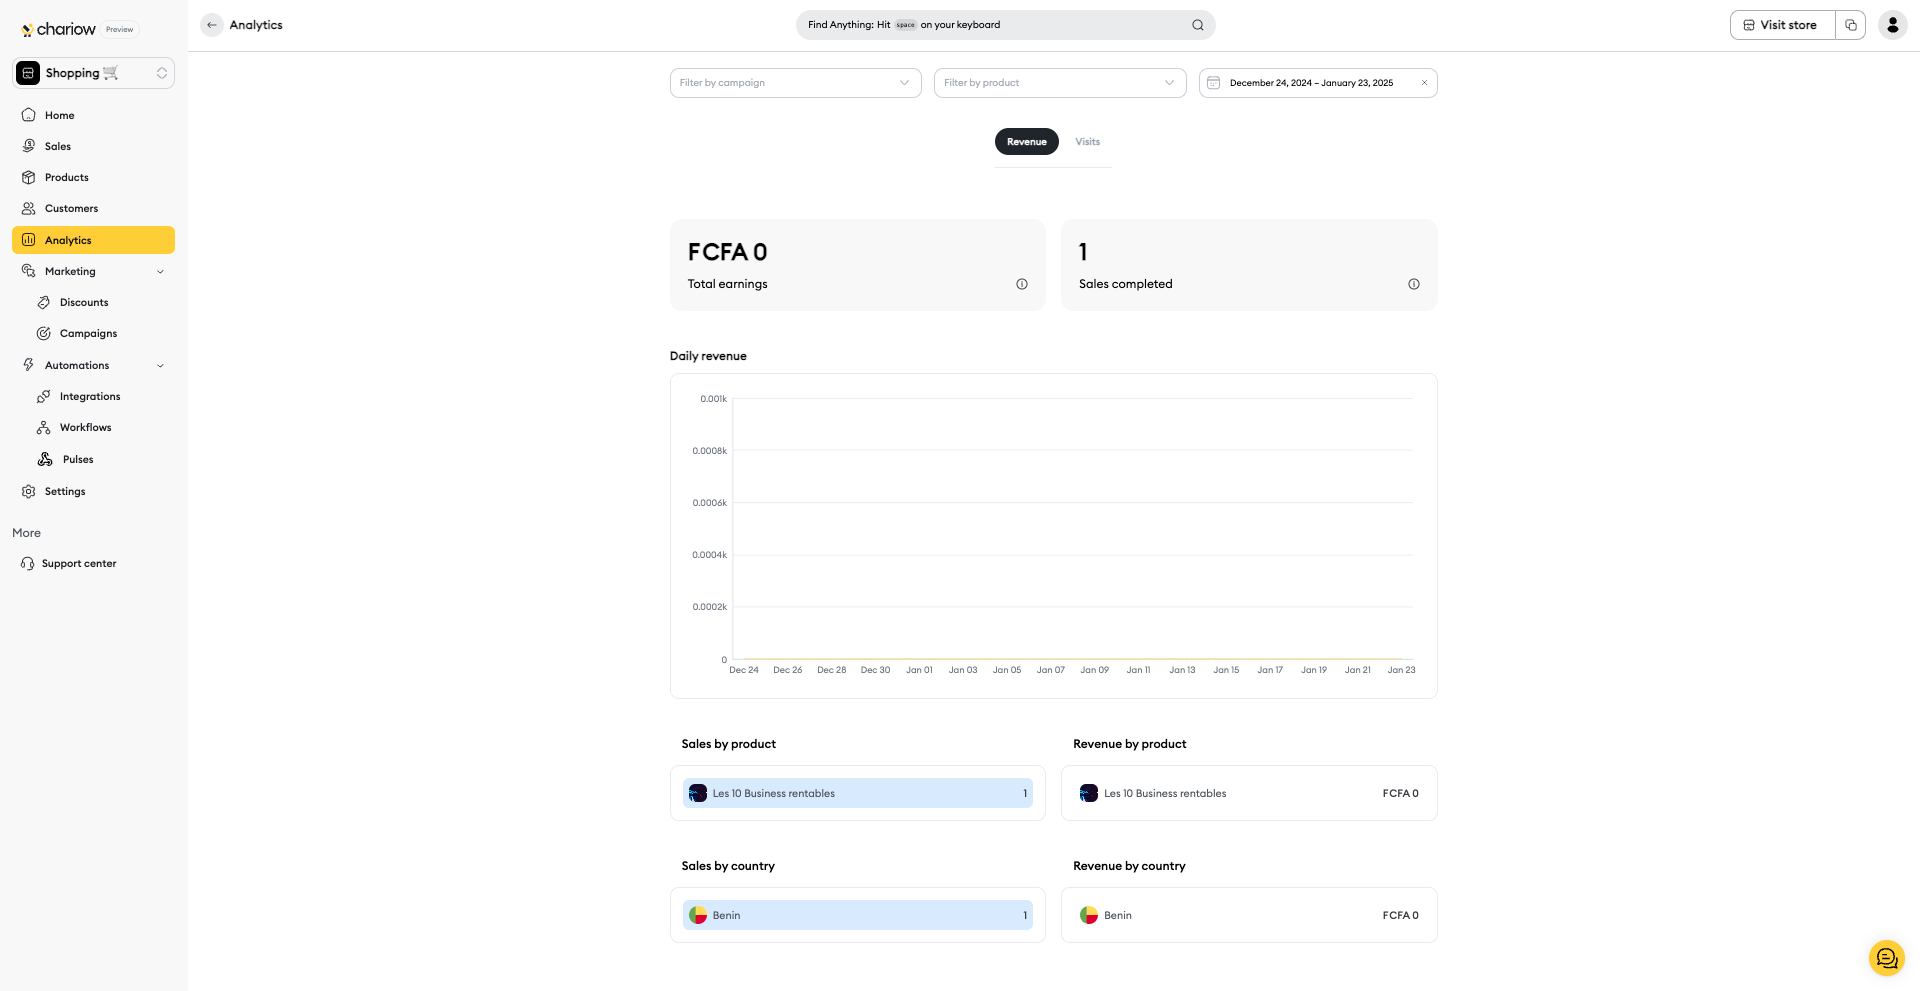
1- Total earnings: The income generated by your shop.
2- Total sales : The total number of sales made.
3- Daily income trend : A detailed view of your earnings per day.
4- Number of sales per product: The best-selling products and their contribution to your revenue.
5- Total revenue per product: The product that generated the most revenue.
6- Number of sales by country: The geographical breakdown of your customers.
7- Total revenue by country: The country in which you earn the most revenue.
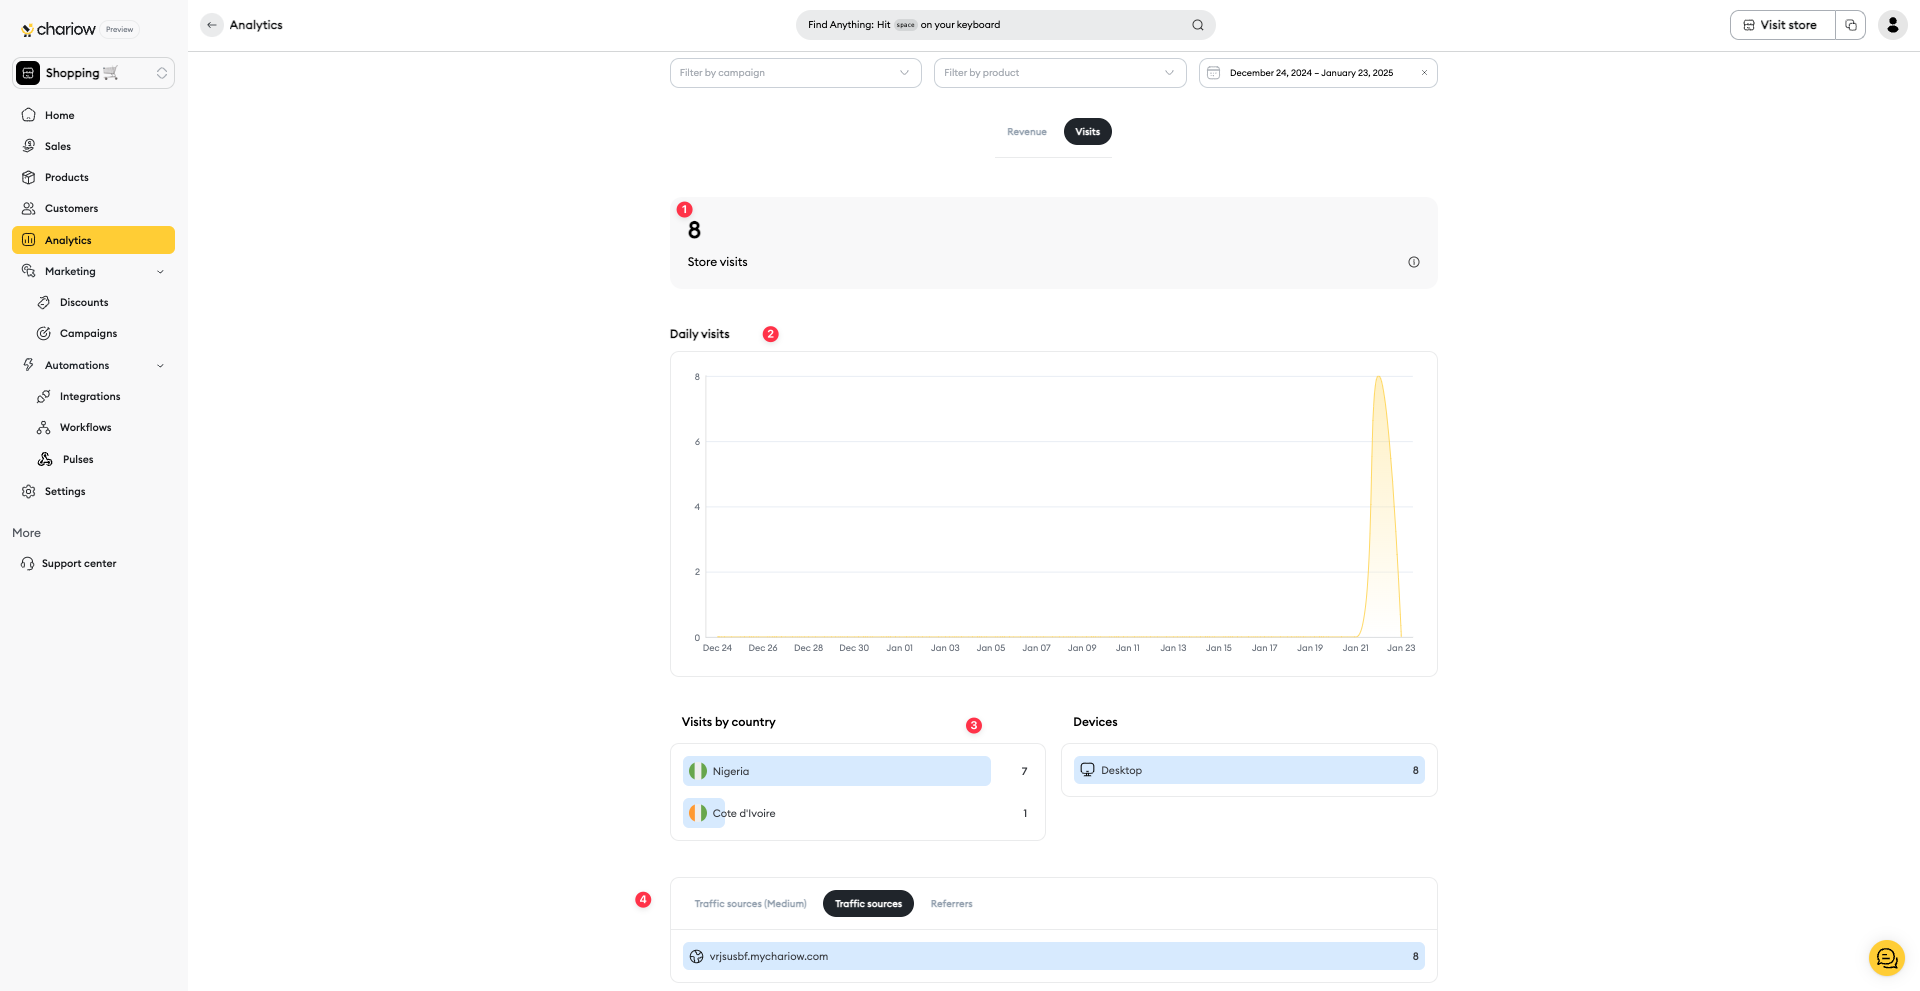
1- Total number of visits to your shop
2- Daily visits: Consult the number of visitors to your shop each day.
3- Visits by country and device used: Identify the countries from which the majority of your traffic originates and find out whether your customers visit your shop from a computer, mobile or tablet.
4- Traffic sources: Determine the number of visits from different traffic sources.
You can also filter the data by period.
Use the various filters at the top of the page to display data for a specific period (e.g. December 2024 - January 2025), by product or by campaign.
Need help? Contact our support team via chat or at [email protected]